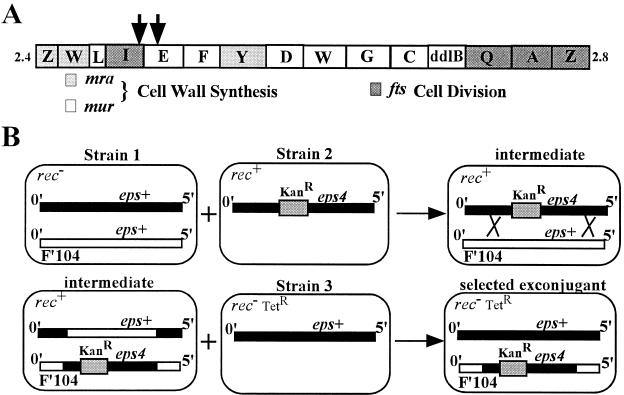
Figure 1.
(A) The mra locus. Shown is a schematic of the mra locus of E. coli present at 2 min. The positions of the mini-Tncam insertions that reduce the ability of F′104eps4 to confer the dominant Eps phenotype are indicated by the arrows. (B) Triparental mating strategy to generate merodiploids. Shown is a schematic of the triparental mating strategy used to generate merodiploids with the eps+ allele on the chromosome and the eps4 allele on F′104. The thick black line represents the 0- to 5-min region of the chromosome. The open line represents the 0- to 5-min region contained on F′104. Relevant alleles present in the 0- to 5-min regions are indicated above the lines. All other relevant genotypic features are indicated in the top left corner of the cartoon cells. The shaded box represents the transposon Tn10kan present at 2 min. The crossed lines represent homologous recombination between the F′ and chromosome. The same strategy was used to generate homozygous eps+ merodiploids by using a strain 2 with eps+ linked to the KanR transposon marker.

