
FIGURE 3.
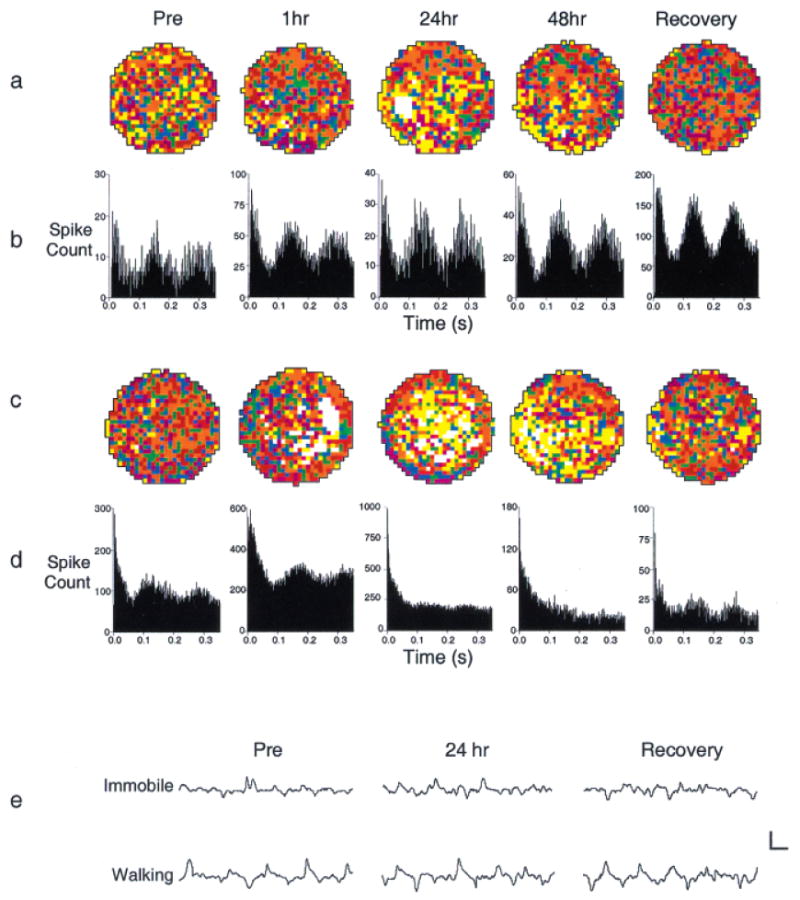
Representative examples of hippocampal theta cell activity recorded before and after vestibular inactivation. a, c: Place by firing rate plots reveal minimal alteration in location-specific firing over the course of vestibular inactivation. Spatial coherence values for these cells at baseline and recovery were as follows: a, 0.243 and 0.487; c, 0.200 and 0.205, respectively. b, d: Respective autocorrelation functions observed for the cells plotted in a and c. The autocorrelation function represents the measure of cell firing at each 1 msec interval (from 0 –350 msec), given a spike discharge at time 0. Autocorrelation functions were constructed by normalizing the spike count for each interval with respect to its peak value. The plot of the theta cell shown in b illustrates a preservation of rhythmic discharge over the course of inactivation, while the plot of the cell shown in d indicates a diminution of rhythmic discharge at 24 h and 48 h postinjection. e: Representative 1-s hippocampal EEG traces are depicted for the cell plotted in a, taken at each of the three time points indicated. Upper traces (Immobile) illustrate the EEG when the rat was stationary. In this case, voltage amplitude was decreased and theta rhythm was not evident. Lower traces (Walking) illustrate the EEG during episodes of locomotion when voltage amplitude was increased and theta rhythmicity was observed. Similar patterns of activity were reflected in EEG traces taken during and following vestibular inactivation; however, traces taken at 24 h suggest a slight irregularity in theta frequency over the course of the 1-sec trace. The calibration scale represents 2 mV/100 ms.