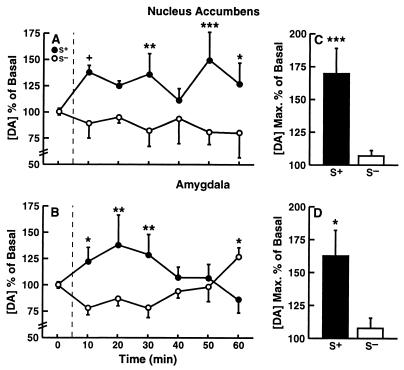
Figure 3.
Mean (± SEM) dialysate DA levels in the nucleus accumbens (n = 10) and amygdala (n = 9) during exposure to the S+ and S− conditions. (A and B) The time course of dopaminergic activation during the 60-min reinstatement test in the two brain regions (***P < 0.001, **P < 0.1, and *P < 0.05; different from respective S− condition). (C and D) The maximal mean (± SEM) increase in DA efflux observed in each animal during the session (***P < 0.001 and *P < 0.05).

