
Fig. 2.
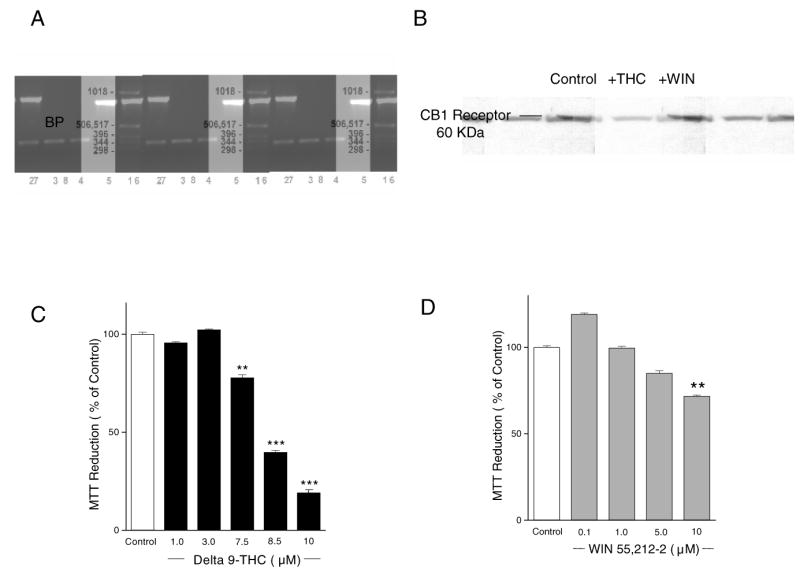
CB1 receptor expression in AF5 cells and toxicity of THC and WIN55,212-2. (A) CB1 receptor gene expression in AF5 cells. Lane 1 is base pair (BP) size, Lanes 2, 3, 4 represent the CB1 receptor transcript in untreated cells, after THC exposure, and after WIN55,212-2 exposure respectively; lanes 5, 6, 7 respectively represent the β-actin housekeeper gene in untreated cells, and after THC exposure and WIN55,212-2 exposure respectively. Lane 8 is a control, containing no cDNA. (B) Western blotting detected a 60-kDa band corresponding to the molecular mass of the CB1 receptor in the untreated cells, and after exposure to THC or WIN55,212-2. (C) Cell viability in AF5 cells treated with varying concentrations of THC. (D) Cell viability after treatment with different concentrations of WIN55,212-2. The total OD value of the control group was normalized to 100%. ** and *** indicate p< 0.01 and p< 0.001, respectively, vs. control.