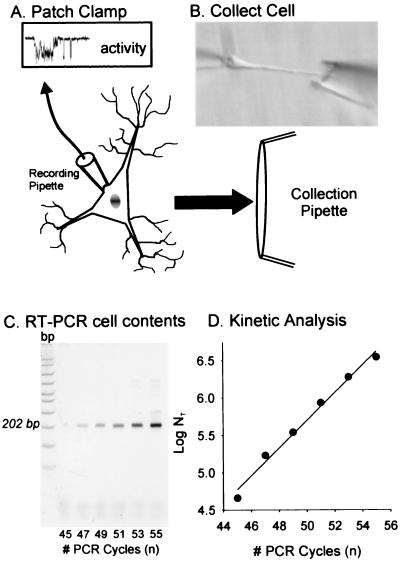
Figure 3.
Summary of the steps for collection and molecular analysis of a recorded cell. (A) Neurons are exposed and recorded from enzymatically treated slices (see Materials and Methods). (B) Neurons are pulled free of the tissue, washed, collected, and transferred to an RT solution. The collected material is subdivided into aliquots, each of which can be examined for a different message. (C) A representative gel shows the amount of RT-PCR signal generated at different cycle numbers for the VSCC α1D message. (D) The signal intensity from each cycle (C) can then be used to generate a kinetic curve.

