
Figure 4. Maturation phenotype of HIV-1 specific CD8+ T cells by HLA type and epitope specificity.
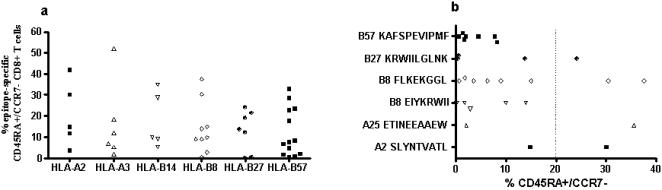
Panel A shows the percentage of CD45RA+/CCR7− CD8+ T cells of 46 HLA-A2, -A3, -B14, -B27 and -B57-restricted epitopes tested in the study cohort. Panel B depicts the percentage of CD45RA+/CCR7− CD8+ T cells specific for six specific HIV-1 epitopes tested (restricting HLA allele and peptide sequence are shown). Data reflective of a total of 21 study subjects, who had responses to the specific HLA-matched optimal epitopes tested (14 Controllers and 5 Progressors).