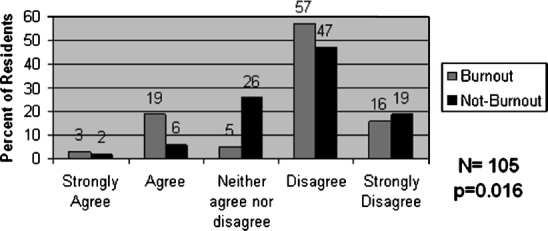
Figure 2.

Percent of residents with burnout versus no burnout preferring 60-hour work week limit over an 80-hour work week. P value represents 2 × 2 comparison of burned-out versus nonburned-out residents that strongly agree or agree versus those residents the neither agree nor disagree, disagree, or strongly disagree.
