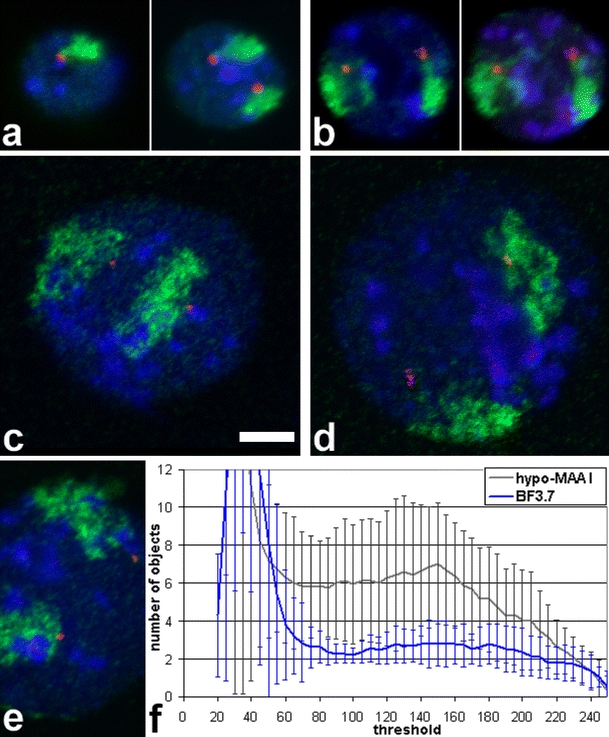
Fig. 6.

Dual color FISH on mouse ES cells with a paint probe to MMU7 (green), a BAC (red) and DNA counterstain (blue). All micrographs are at the same scale (bar 5 μm). While territories in BF-fixed nuclei (a, b) appear compact, territories after Hypo-MAA fixation (c–e) mostly have a disrupted, torn appearance which is in line with the increased diameter of their nuclei. In BF-fixed nuclei, BAC signals are connected to chromosome territory signals. For nuclei in (a) and (b), a single confocal section (left) and a projection of the stack (right) are shown. (c)–(e) are single confocal sections. (f) Object counting reveals a much higher disintegration of chromosome territories in Hypo-MAA-fixed nuclei (n = 33) than in BF-fixed nuclei (n = 39). While values below a threshold of 80 are influenced by nuclear background, above 200 chromosome territories start to fall below threshold. From 80 to 200, territories in BF-fixed nuclei show separation in about two objects, one for each chromosome territory, while in Hypo-MAA-fixed nuclei, the values are around 6. Also, the variation is much larger, indicated by the larger standard deviation (error bars)
