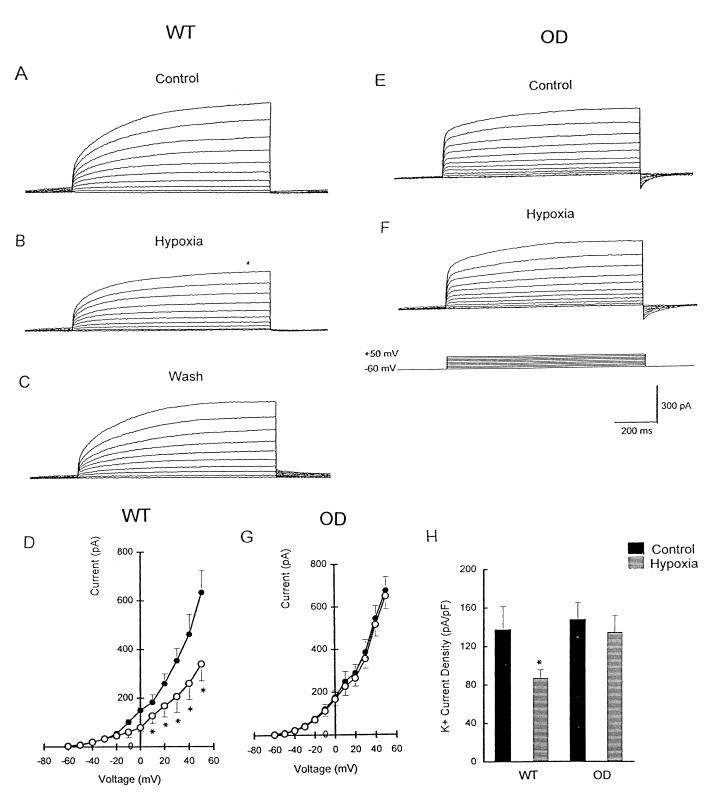
Figure 2.
Effect of hypoxia on K+ current in NEB cells of WT versus OD mice. (A) Outward K+ current in WT cells evoked by depolarizing steps from −60 mV to +50 mV in control Krebs solution. (B) Outward current as described for A was inhibited by hypoxia, and the effect was reversible (C). (D) Current–voltage (I–V) relationship for WT cells in control (●) and hypoxic solution (○). Holding potential was −60 mV (*, P < 0.05; n = 9). (E) K+ current in OD cells evoked by depolarizing steps from −60 mV to +50 mV in control solution. (F) Hypoxic solution failed to reduce K+ currents in OD cells. (G) I–V relationship was similar for OD cells (n = 12) in control (●) and hypoxic solution (○). (H) Comparison of K+ current density in WT and OD cells under control (black bars) and hypoxic (hatched bars) conditions. Current density estimated by dividing peak current (+50-mV test potential) by input capacitance. K+ current density was decreased significantly (relative to control) during hypoxia in WT cells (n = 8; *, P < 0.05); in contrast, hypoxia had no effect on K+ current density in OD cells (n = 8).

