Figure 4.
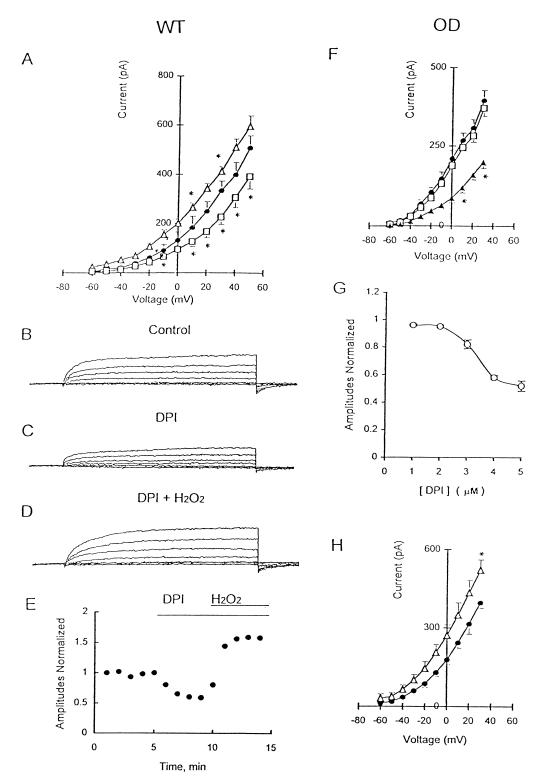
Effects of DPI and H2O2 on the K+ current in NEB cells of WT and OD mice. (A) I–V relationship for WT cells under control conditions (●; n = 7) or during perfusion with 1 μM DPI (□; n = 6) or with 0.25 mM H2O2 (▵; n = 4). *, P < 0.05. Outward K+ current evoked by depolarizing steps from −60 mV to +30 mV in control solution (B) was reduced during bath application of 1 μM DPI (C) and augmented ≈37% during combined exposure to 0.25 mM H2O2 and 1 μM DPI (D). (E) Time course of normalized K+ current amplitude after application of DPI and DPI plus H2O2. All responses were normalized to peak current under control conditions (+30-mV test potential). (F) I–V relationship for OD cells under control conditions (●; n = 9) and after perfusing DPI at 1 μM (□; n = 6) and at 5 μM (▴; n = 6) DPI. *, P < 0.05. (G) Dose-response relationship for DPI; responses were normalized to the peak control current at +30-mV test potential. (H) I–V relationship for OD cells in control solution (●) and after perfusing 0.25 mM H2O2 (▵). *, P < 0.05.

