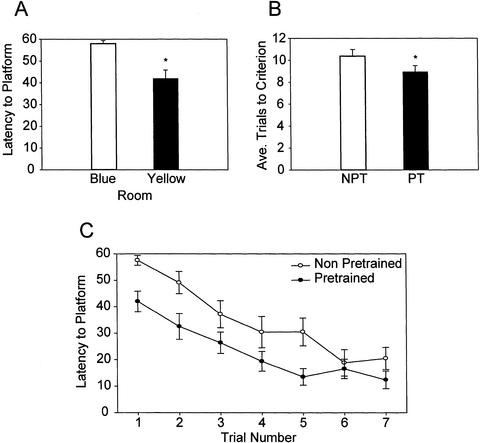
Figure 4.
Pretraining in a separate water maze facilitates training. (A) Latency to the platform during the first pretraining trial (Blue) versus the first training trial (Yellow). (B) Average number of trials to criterion for non-pretrained (NPT) animals from Experiment 1 versus the pretrained (PT) animals from Experiment 2. (C) Training curves broken down into individual trials. Latency to platform during the first seven training trials for NPT animals from Experiment 1 versus the PT animals from Experiment 2 (two-way repeated measures analysis of variance [ANOVA] on Ranks NPT versus PT p < .05). Data are presented as the mean ± SEM, * p < .05.

