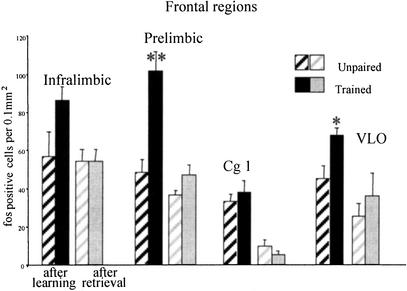
Figure 3.
Frontal regions: Mean number of c-fos immunoreactive cells per 0.1 mm2 in frontal regions of unpaired controls and trained rats after training (left) or after retrieval test (right). In the PLC and ventrolateral orbital cortex (VLO), there was a significant increase in c-fos immunoreactivity in trained rats relative to controls after training (**prelimbic: P < .005; *VLO: P = .03).

