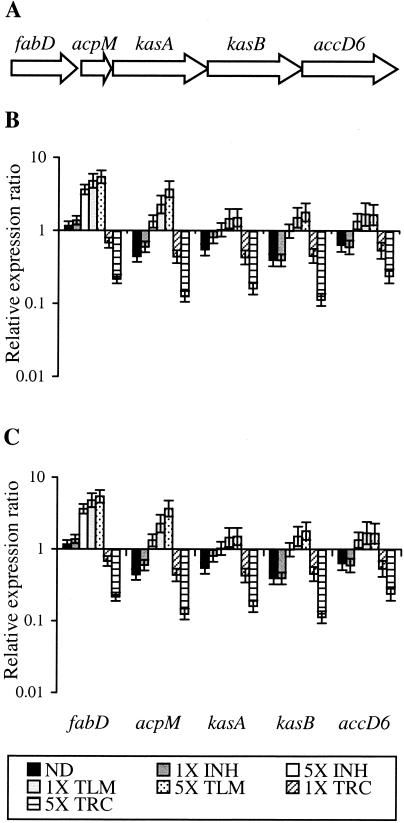
FIG. 3.
Response of the kas operon to isoniazid, thiolactomycin, or triclosan treatment as measured by QRT-PCR. (A) Schematic representation of the kas operon in the M. tuberculosis H37Rv genome. Ratio between the number of cDNA copies detected in each sample relative to the time zero control by QRT-PCR at 2 h (B) and 6 h (C) is represented. Each value is the average of two biological replicates, each analyzed in duplicate. INH, isoniazid; TLM, thiolactomycin; TRC, triclosan.

