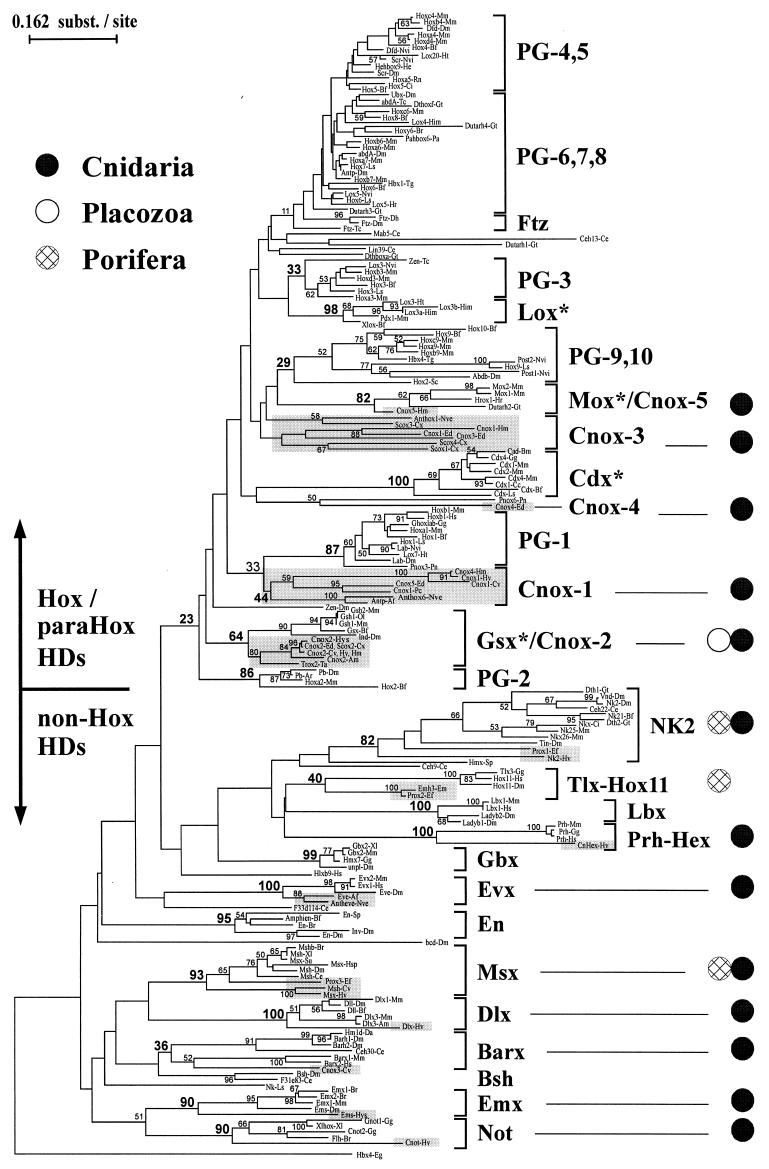
Figure 2.
Phylogenetic relationships between 200 Antp-class genes inferred by NJ analysis by using Dayhoff's PAM distance matrix. The tree was rooted with a Prd-class sequence. All branch lengths were drawn to scale. Numbers at nodes indicate percentages of 200 bootstrap replicates that support the branch; values under 50% are omitted, except for some significantly important nodes. Support values for each family defined on the right are marked in bold. Sequences from diploblasts are in shaded boxes.

