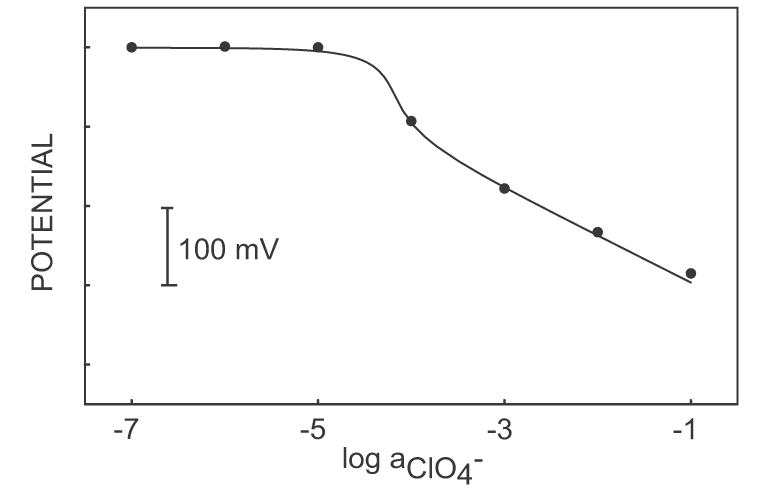
Figure 2.

Calibration curve for NaClO4 in a 0.1 M NaCl background in the pulse chronopotentiometric measuring mode. The dots show experimental electrode response and the solid line shows response as calculated from theory with the following parameters: Dm = 2 x 10⁻⁸ cm2 s−1, Daq = 2 x 10⁻⁵ cm2 s−1, i = 3 μA, δm = 2 μm, A = 0.2 cm2, and KI,ClO4pot = 105.
