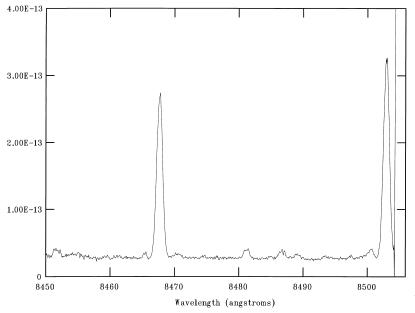
Figure 5.
Plot of the Hamilton echelle spectrum of the planetary nebula NGC 6572, obtained on Sept. 1, 1991, in the wavelength interval 8450–8505 Å, showing the [Cl iii] 8480.9 and 8500.0 Å lines, where the flux is in units of erg⋅cm−2⋅sec−1⋅Å−1. Also shown are the 8467.3 and 8502.5 Å emission lines of H i. We note that the structure in the emission lines is due to shell expansion within the nebula. Radial velocity and interstellar extinction corrections (C = 0.4) have not been applied to this spectral scan.

