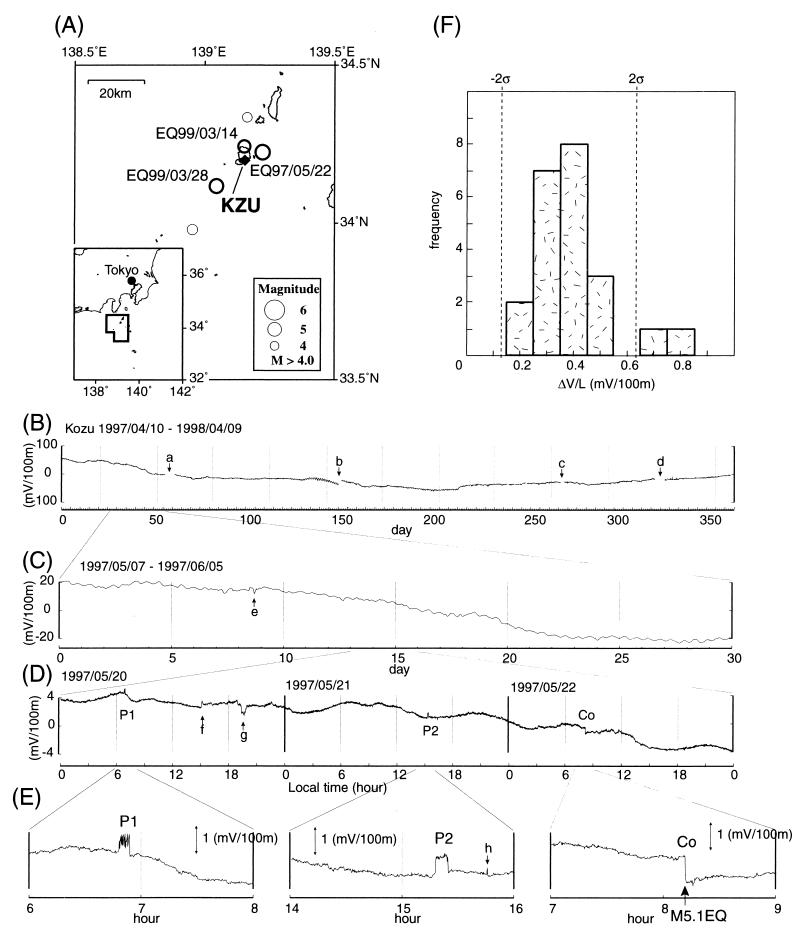
Figure 3.
(A) Seismicity (M > 4.0) around Kozu-shima Island (97/04/10–99/05/31) and KZU station. Although not shown in the map, there were 24 M ≥ 3.5 EQs in the region. (B) A 1-year record at one of the short dipoles at KZU station, showing the long-term stability of measurement. The hourly mean value is shown. a, b, c, and d indicate interruptions of recording. (C) A 1-month record. The hourly mean value is shown. Semidiurnal change represents the tidal effect. e indicates a change induced by geomagnetic variation. (D and E) Shown are 3-day and 2-h records of 10 s mean values, showing the preseismic changes P1 and P2, as well as the coseismic changes (Co). f, g, and h indicate changes induced by geomagnetic variations. (F) Frequency histogram of recognized anomalous changes during the observation period.

