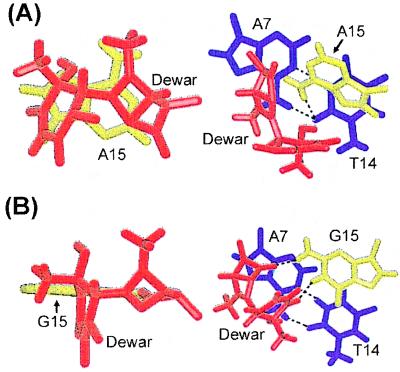
Figure 3.
Comparative stick view of the stacking interactions of (A) the A15 residue (DW/AA duplex) and (B) the corresponding G15 residue (DW/GA duplex) opposite the 3′ T of the Dewar product with two bases of the Dewar product (Left) and the adjacent A7⋅T14 base pair (Right). The two thymine bases (T5, T6) of the Dewar product are colored red, and the opposite G15 and A15 residues are colored yellow. The A7⋅T14 base pair is colored dark blue. The dotted lines indicate the hydrogen bonds, as determined with the program insight ii.

