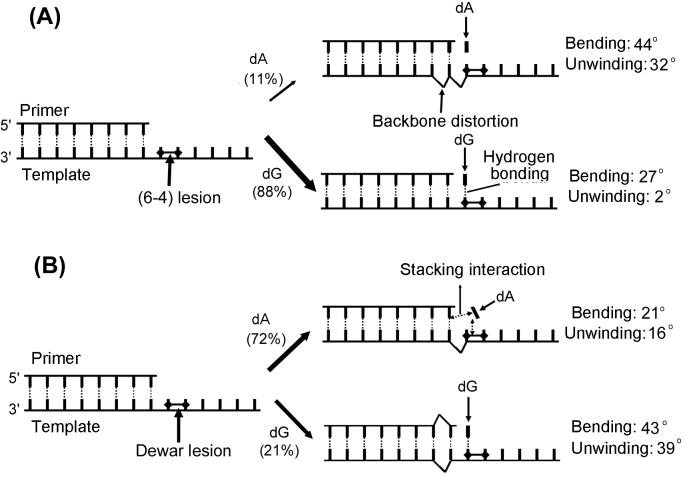
Figure 4.
Summary of conformational features after base insertion opposite the 3′ T site of (A) the (6–4) adduct and (B) the Dewar product during TR. The conformational features represented in this figure are indicated. The values of the helical bending and unwinding of the model duplexes studied herein and previously are shown (Right). The incorporating frequencies of the A and G residues opposite the 3′ T site of the photoproducts during TR (6) are shown in parentheses at the center of the figure.

