
Fig. 15.
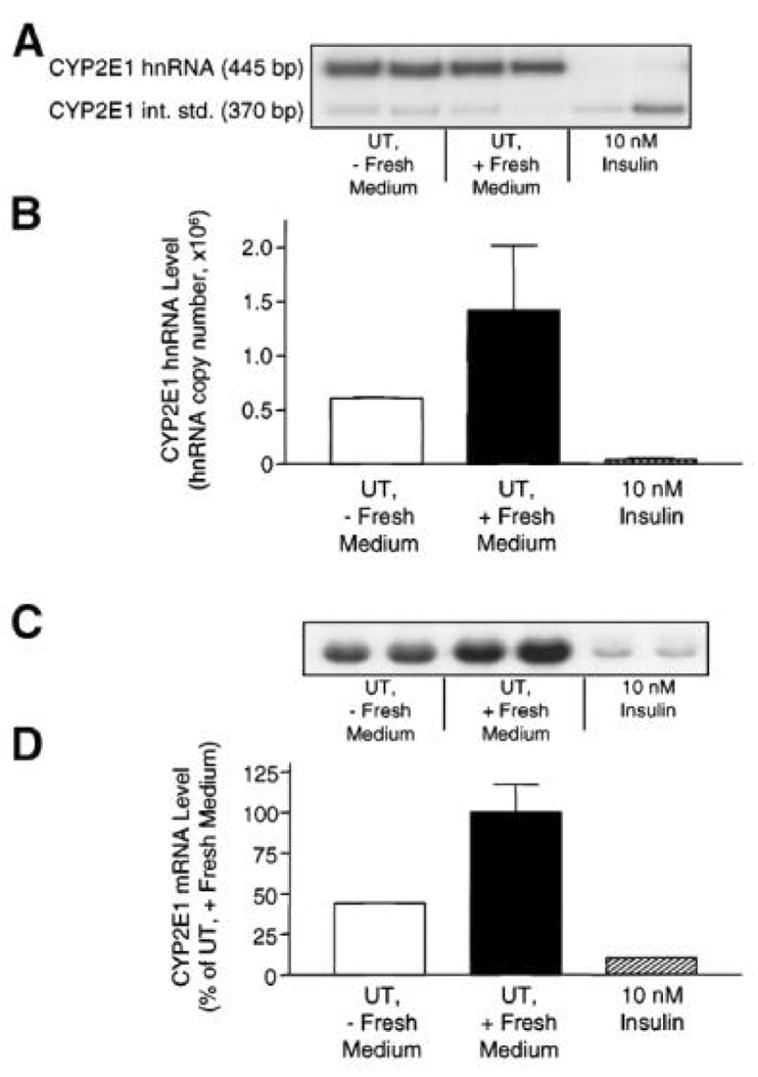
Effect of insulin on CYP2E1 gene transcription monitored by CYP2E1 hnRNA analysis. After the 4-hour plating period in the presence of 1μmol/L insulin, hepatocytes were maintained in the absence of insulin for 48 hours. Hepatocytes were then treated for 20 hours without medium change (UT, - Fresh Medium), with fresh medium alone (UT, + Fresh Medium), or with 10 nmol/L insulin in fresh medium (10 nmol/L Insulin). (A) Polymerase chain reaction products of CYP2E1 hnRNA and CYP2E1 internal standard. (B) CYP2E1 hnRNA levels plotted as hnRNA copy number, normalized to CYP2E1 internal standard band density. Data are mean ± range of hnRNA band densities from 2 preparations of total RNA. (C) Northern blot of CYP2E1 mRNA levels in identical samples used for hnRNA analysis. (D) CYP2E1 mRNA levels in C plotted as a percentage of the CYP2E1 mRNA level monitored in hepatocytes treated with fresh medium (UT, + Fresh Medium), normalized to 7S RNA band density.
Reprinted from Woodcroft, KJ, Hafner, MS and Novak, RF, Hepatology, 35, 263–273, 2002, with permission.