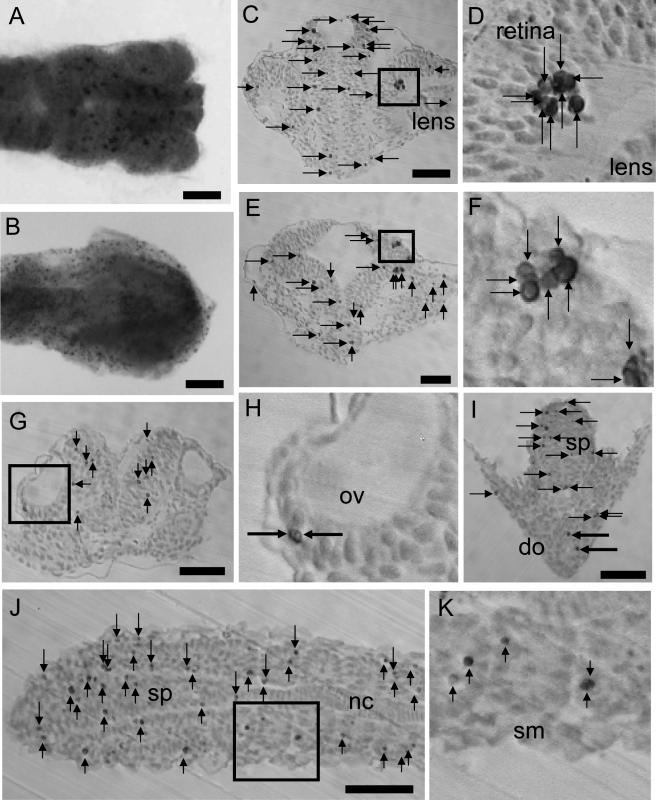
Fig. 1.
Visualization of apoptosis by TUNEL in the head. A: Stage 24 embryos observed from the dorsal view. B: TUNEL-positive cells after 20 hr of UV light exposure. C: Coronal section of forebrain containing eye. D: The square in C is magnified in this photograph. E: Coronal section of midbrain. F: The square in E is magnified in this photograph. G: Coronal section of hindbrain containing otic vesicle. H: The square in G is magnified in this photograph. I: Coronal section of spinal cord and digestive organ. J: Horizontal section of spinal cord and somite. K: The square in J is magnified in this photograph. ov, otic vesicle; do, digestive organ; sp, spinal cord; nc, notochord; sm, somite. Arrows indicate apoptosis counted. Large arrows in I indicate apoptosis counted in the digestive organ. Bar=50 µm.

