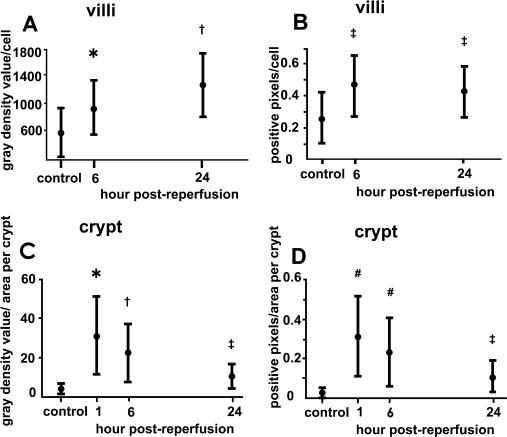
Fig. 6.
Morphometry of claudin-4 expression. (A) Total gray density value of claudin-4 immunolabeling per cell on villi. * p<0.05 compared with control and 24 hr post-reperfusion. † p<0.05 compared with control and 6 hr post-reperfusion. (B) The number of claudin-4-positive pixels per cell on villi in the binary image. ‡ p<0.05 compared with control. (C) Total gray density value of claudin-4 immunolabeling per area of crypt. (D) The number of claudin-4-positive pixels per area of crypt in the binary image. (C, D) * p<0.05 compared with control and 6 and 24 hr post-reperfusion. † p<0.05 compared with control, 1 hr, and 24 hr post-reperfusion. ‡ p<0.05 compared with 1 hr and 6 hr post-reperfusion. # p<0.05 compared with control and 24 hr post-reperfusion. Scheffé’s test.

