
FIGURE 1.
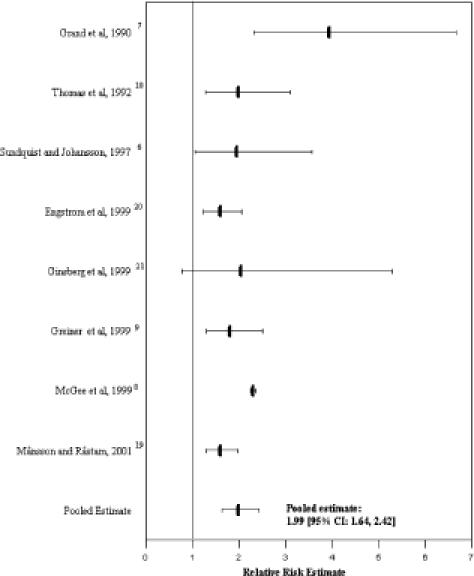
Relative risk estimate of mortality associated with general self-rated health in studies collapsing response options into 2 categories. *Bars represent the relative risk estimate reported for these studies and the lines represent the 95% confidence interval. The reference category was the highest (e.g., excellent) self-rated health category offered to the respondent.