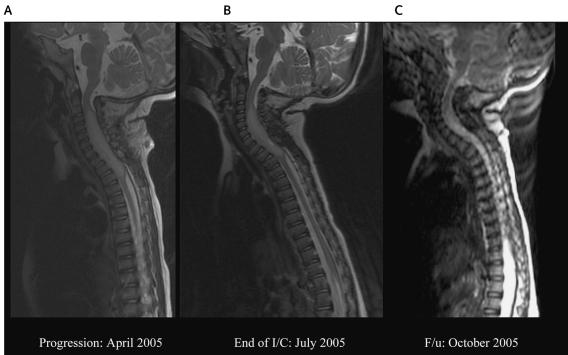
Fig. 3.
MRIs of the spine of patient 3. (A) MRI at diagnosis, showing an intramedullary tumor, 61 mm long × 15 mm wide, from C2 to T3. (B) MRI at the end of irinotecan and cisplatin (I/C) chemotherapy, showing a significant decrease in the tumor mass (from C5 to T2), with no contrast enhancement, suggestive of tumor regression. (C) A follow-up (F/u) MRI showing a continued decrease in the tumor size and progressive normalization of the cervical cord.

