Figure 1.

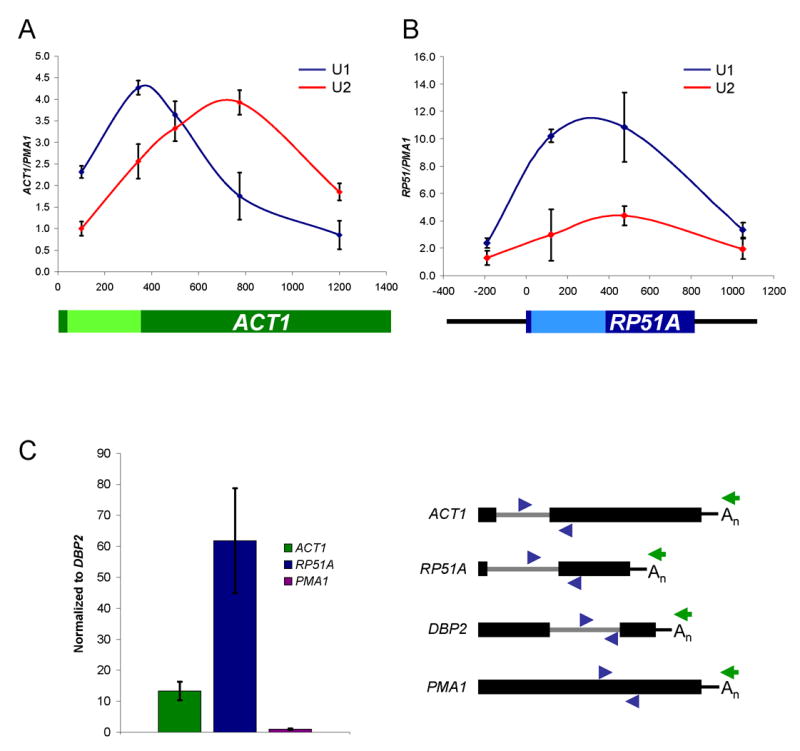
ACT1 and RP51A recruit different levels of U1 and U2 snRNPs cotranscriptionally. (A) ChIP results for U1 (blue) and U2 (red) snRNP recruitment to ACT1. Enrichment is expressed as ACT1 signal normalized to an intronless gene, PMA1. The exons (dark green) and intron (light green) of ACT1 are shown in the schematic below the graph. (B) ChIP results for RP51A. The exons (dark blue), intron (light blue), and upstream/downstream sequence (thin black line) of RP51A are shown in the schematic below the graph. (C) U1 snRNP IPs to characterize post-transcriptional RP51A and ACT1 pre-mRNA association. Pre-mRNA association (IP:IN ratio) is normalized to DBP2 pre-mRNA, which is highly U1-associated post-transcriptionally. Values were then set to 1.0 for PMA1, an intronless negative control. Schematics of genes (exons – thick black lines; introns – thin gray lines), PCR primer pairs (blue), and oligo dT (green) are shown to the right of the graph. Genes are not drawn exactly to scale. All data represent the average of at least two independent experiments and error bars report average deviation.
