
Figure 2.
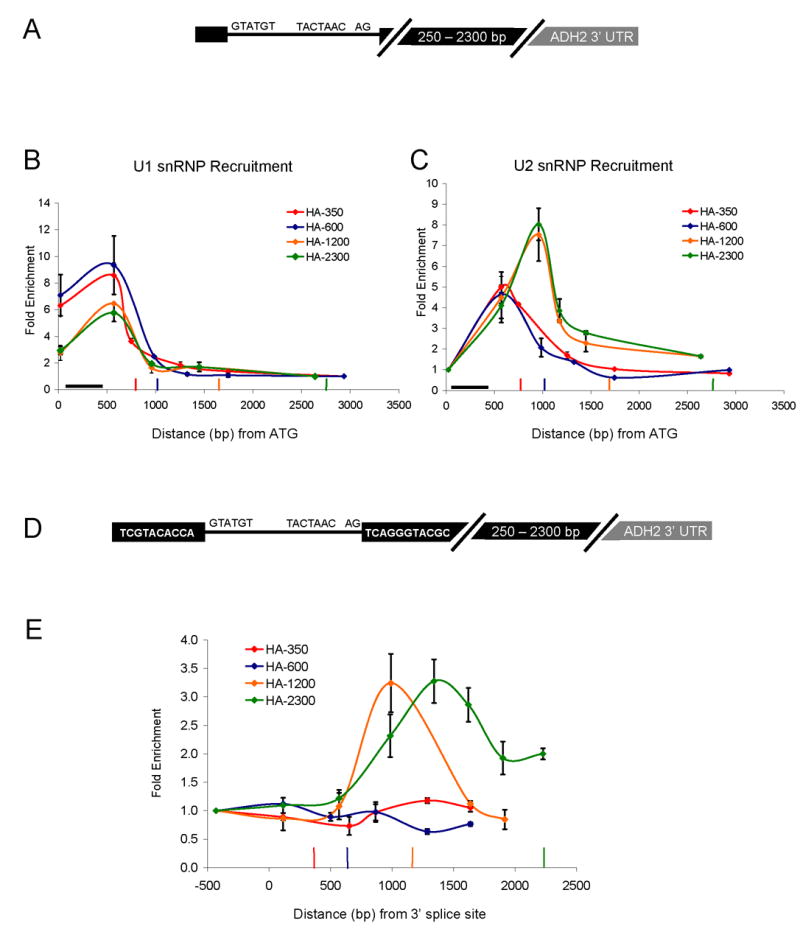
Second exon length determines extent of cotranscriptional spliceosome assembly and splicing. (A) Schematic of HZ18-ADH2 derivatives. Constructs differ only in second exon length. (B) U1 snRNP ChIPs to HZ18-ADH2 derivatives. Fold enrichment is expressed relative to the last primer pair. Black horizontal bar indicates intron position. Vertical colored bars indicate cleavage/polyadenylation signals for the corresponding colored HZ18-ADH2 construct. (C) U2 snRNP ChIPs to HZ18-ADH2 derivatives. Fold enrichment is expressed relative to the first primer pair. (D) Schematic of split MS2 HZ18-ADH2 derivatives. (E) MS2-HA ChIPs to split MS2 HZ18-ADH2 constructs. Fold enrichment is relative to first primer pair. Vertical colored bars indicate cleavage/polyadenylation signals for the corresponding colored split MS2 HZ18-ADH2 construct. X-axis is distance from the 3′ ss (rather than from ATG). All data represent the average of at least two independent experiments and error bars report average deviation.