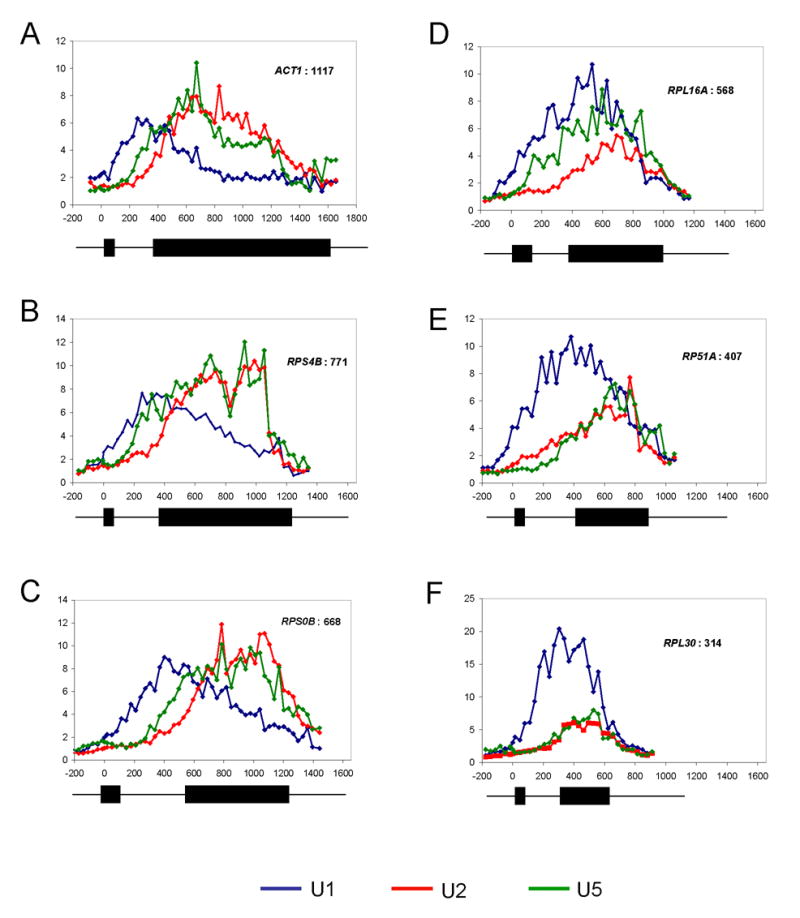
Figure 5.

Progressive spliceosome assembly. (A–F) U1, U2, and U5 snRNP ChIP-CHIPs from whole-genome tiling arrays are shown for six representative genes. Fold enrichment is expressed relative to intergenic background. U1 is blue, U2 red, and U5 is green. Gene schematics are shown below each gene. All scales (distance from ATG) are the same. (A) ACT1, 1117 bp exon (B) RPS4B, 771 bp (C) RPS0B, 668 bp (D) RPL16A, 568 bp (E) RP51A, 407 bp (F) RPL30, 314 bp.
