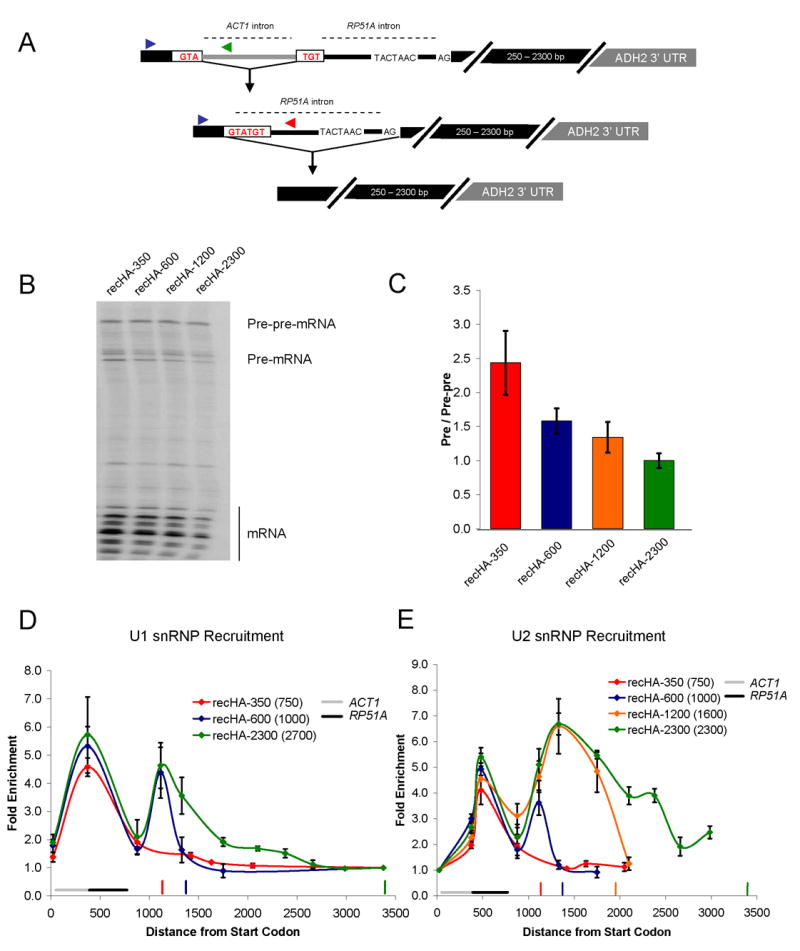
Figure 6.

Cotranscriptional U1 snRNP recruitment enhances splicing efficiency. (A) Schematic of recursive splicing construct. The ACT1 intron interrupts the 5′ ss of RP51A and must be removed prior to RP51A intron splicing. (B) Primer extension analysis of recursive splicing constructs. (C) Quantitative RT-PCR of recursive splicing constructs (shown in B). Primer pairs specific to the pre-pre-mRNA and pre-mRNA were used to generate a pre-mRNA to pre-pre-mRNA ratio. Location of these primers is shown in (A). The same forward primer (blue arrow) was used to analyze both pre-pre-mRNA (reverse primer; green arrow) and pre-mRNA (reverse primer; red arrow). These were normalized to recHA-2300, which was set to 1.0. (D) U1 snRNP recruitment to recursive constructs. Fold enrichment is relative to the last primer pair. Location of ACT1 and RP51A introns is noted. Vertical colored bars indicate cleavage/polyadenylation sites of the corresponding recursive construct. In the legend, the numbers in parentheses are the second exon lengths for the ACT1 intron (these include the RP51A intron as part of the “exon”). Note that recHA-1200 data was omitted from this figure to prevent too many recruitment curves from obscuring the main point. U1 and U2 recruitment to recHA-1200 is essentially the same as HA-2300 (data not shown). (E) U2 snRNP recruitment to recursive constructs. Fold enrichment is relative to the first primer pair. All data represent the average of at least two independent experiments and error bars report average deviation.
