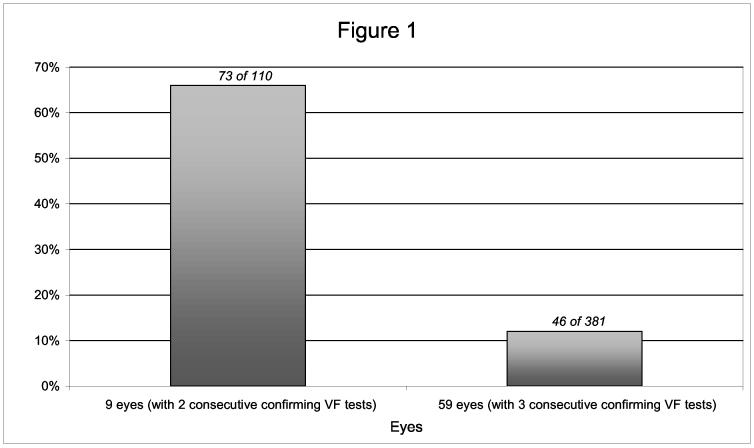
Figure 1.
The percentage of normal follow-up VF tests following a VF POAG endpoint in nine eyes based on 2 consecutive, abnormal, and reliable VF tests and in fifty-nine eyes based on 3 consecutive, abnormal, and reliable VF tests. P = 0.013 Table 1: Frequency Distribution of Normal Visual Field Tests Following an OHTS Visual Field POAG Endpoint

