
Figure 4.
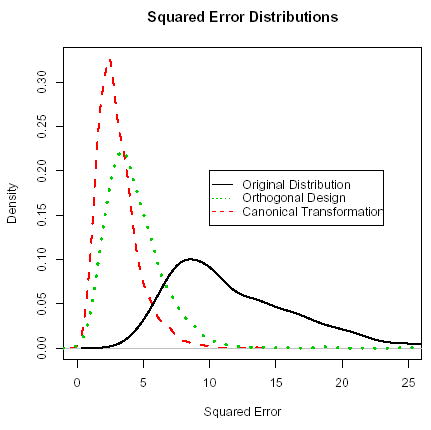
Density distributions for the squared error for clustering the estimated coefficients using (i) the original design matrix (solid curve), (ii) an orthogonal design matrix (dotted curve), and (iii) canonically transformed coefficients (dashed curve).