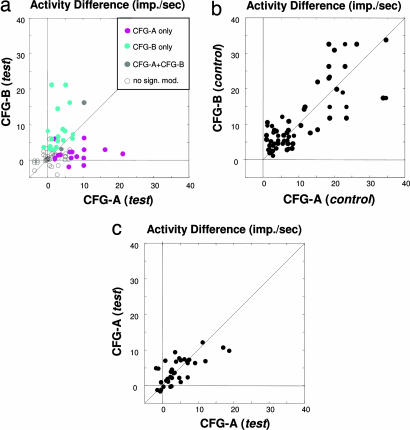
Fig. 3.
Most neurons do not transfer perceptual modulation between different BRFS configurations (data from monkey E00 by using the random dot motion stimuli; see SI Fig. 6 for data of both monkeys and the grating stimuli). (a) Scatter plot of mean activity difference (in spikes per sec) between the preferred and nonpreferred stimulus for the time period of 200–800 msec following flash suppression (resulting in identical stimulation with both stimuli on the screen). Each dot represents the average firing rates of one neuron. All significant response differences are color coded in gray (significant response differences for both stimulus configurations), cyan (significant response differences for CFG-B only), and magenta (significant responses for CFG-A only). The plot is a superposition of six plots obtained by individual stimulus comparisons. Accordingly, the CFG-A and CFG-B correspond to the following stimulus pair comparisons: configuration 3 vs. 4, 4 vs. 2, 3 vs. 2, 1 vs. 2, 3 vs. 1, and 1 vs. 4. Note that n (71) corresponds to the number of comparisons, rather than the absolute number of neurons (32). Neurons that were selective for more than two of the tested configurations are represented multiple times. There was no correlation between the response levels for each stimulus configuration (r = 0.2, P = 0.1). See Table 1 for a summary of all six individual cross-configuration comparisons. (b) Scatter plot of mean spike rate differences between the preferred and nonpreferred stimulus for the time period of 200–800 msec following physical alternation (resulting in monocular stimulation with either the preferred or nonpreferred stimulus). Each dot represents firing rates of a single neuron for the same population of cells as in a. Accordingly, CFG-A and CFG-B label the same comparisons between rival stimuli used in a. Response differences for physical alternation are typically larger than those obtained during flash suppression (for easier comparison, both plot axes are cropped at 40 Hz). Note the strong correlation of activity levels under this condition (r = 0.69, P < 0.001), indicating that the lack of correlation during flash suppression is not based on response differences to the monocular components chosen for comparison. (c) For the within-configuration comparison shown here, we divided up all trials of each of the four stimulus configurations and computed the average activity level for each of these data subsets. The high correlation (r = 0.75, P < 0.001) demonstrates the consistency of MT responses for repeated measurements during this task, thus ruling out trial-by-trial variability as the prime cause for the lack of correlation in a. Note that only the data between 0–40 imps per sec are shown.

