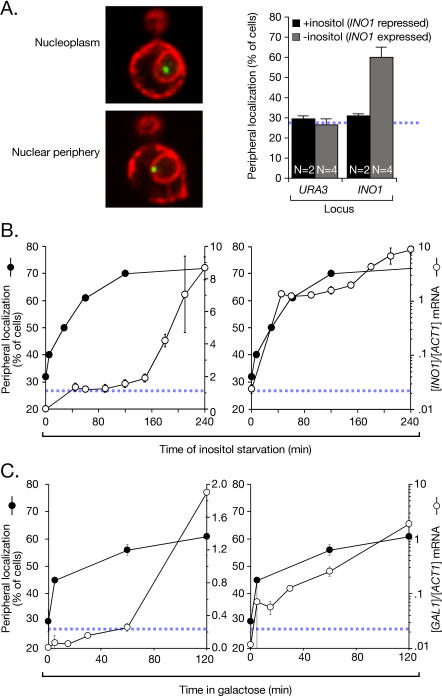
Figure 1. Recruitment of INO1 and GAL1 to the Nuclear Periphery Is Rapid.
(A) Left: merged confocal micrographs of cells stained for Lac I-GFP (green) and Sec63-myc (red), and scored as peripheral or nucleoplasmic. Right: cells having the lac repressor array integrated either at URA3 (strain JBY409) or INO1 (JBY397) were grown in the presence or absence of inositol, and scored for peripheral localization as described [6]. Data are averages of multiple replicates (indicated as N) from independent cultures. Each replicate represents 30–50 cells. The hatched blue line represents the baseline level of peripheral localization for the URA3 gene.
(B) At the indicated times after removal of inositol, cells were scored for peripheral localization of INO1 (filled circles, extrapolated to 300 min [Figure S1]; two replicates of 30–50 cells). Also, INO1 mRNA abundance was quantified using RT Q-PCR and expressed relative to ACT1 mRNA (open circles; [58]). Left panel: both datasets plotted on a linear scale. Right panel: the mRNA abundance was plotted on a logarithmic scale, and the localization was plotted on a linear scale.
(C) The localization of the GAL1 gene (two replicates of 30–50 cells) and the GAL1 mRNA abundance were quantified in strain DBY32 and plotted as in (B).

