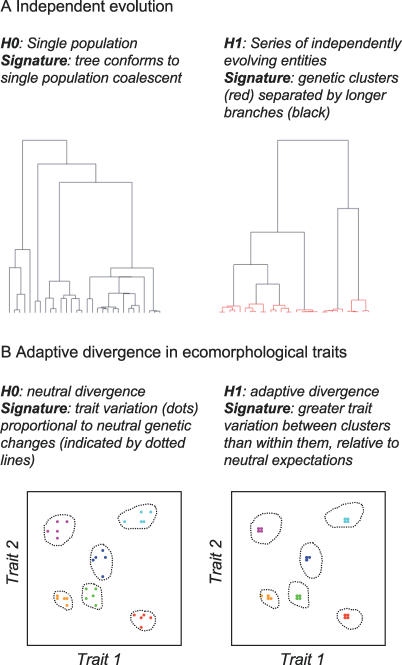
Figure 2. Scheme Showing the Predicted Patterns of Genetic and Morphological Variation Underlying Our Tests of Alternative Scenarios of Diversification.
(A) Hypothetical trees showing expected genetic relationships among a sample of individuals under the null model that the sample is drawn from a single asexual population (H0) and under the alternative model that the clade has diversified into a set of independently evolving entities (H1).
(B) Expected variation in two ecomorphological traits evolving either neutrally (H0) or by adaptive divergence (H1) in a genus that has diversified into six genetic clusters. Note that a mixed pattern is possible: Some genetic clusters may have experienced divergent selection on morphology, whereas others have not.

