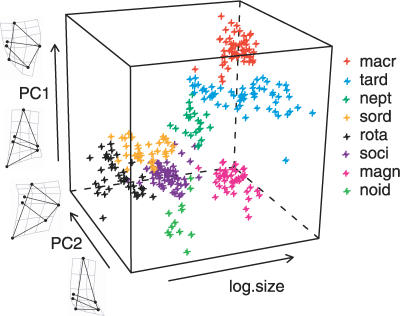
Figure 4. Plot of the Size and Shape (the First Two PCs, PC1 and PC2, from the Generalized Procrustes Analysis) of Trophi across Species.
The directions of shape variation along each axis are shown for PC1 and PC2, respectively, using ×2 and ×4 magnification of the observed variation for emphasis. PC1 represents a continuum from oval to rounder trophi and from parallel to converging major teeth. PC2 represents a trend in the distance of the major teeth from the attachment point between the two halves of the trophi.

