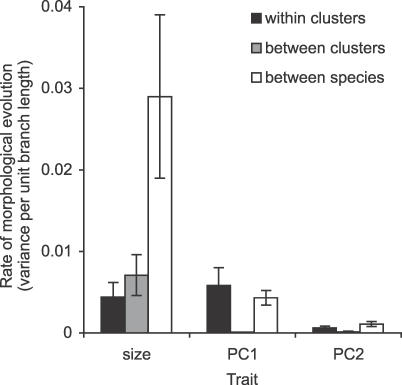
Figure 5. Evolutionary Rates of Changes in Trophi Size and Shape.
Rates are expressed as the variance in each trait per unit branch length. Branch lengths are in units of the number of silent substitution per codon of cox1. Estimates from the maximum model with three rate classes are shown: within clusters, between clusters within taxonomic species, and between taxonomic species. Error bars show confidence limits within 2 log likelihood units of the maximum likelihood solution. Hierarchical likelihood ratio tests indicated that the model for size could be simplified to assume a joint rate for within cluster and between cluster branches (Table S5).

