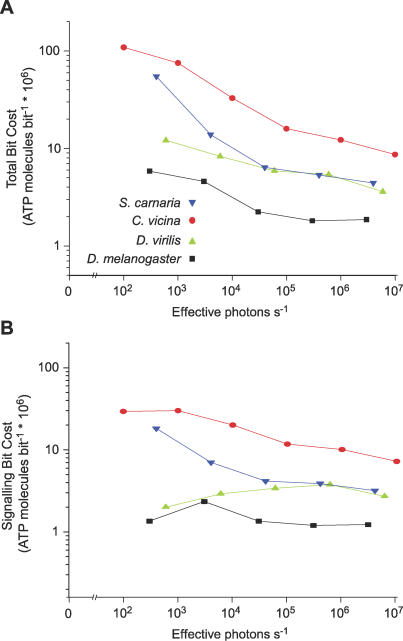
Figure 5. The Metabolic Cost of Information Decreases with Increasing Light Intensity.
(A) A double logarithmic plot of metabolic cost per bit at each effective photon rate and (B) a double logarithmic plot of the metabolic cost of signalling per bit at each effective photon rate are shown. Measurements are from R1–6 photoreceptors from four species, S. carnaria (blue), C. vicina (red), D. virilis (green), and D. melanogaster (black).

