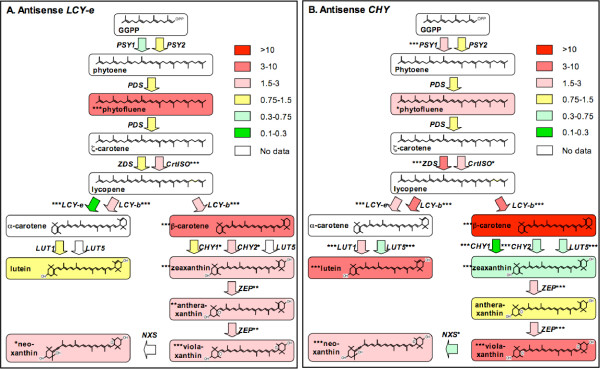
Figure 2.

Schematic representation of metabolite and gene expression changes in engineered tubers. Boxes represent the metabolic intermediates, arrows represent the genes catalyzing the various reactions. Fold induction or repression with respect to the wild-type – averaged over three transgenic lines- is represented by different hues of red or green, respectively (see legend). White means that no data are available. Asterisks indicate significance of the fold variation with respect to the Wt in an ANOVA test (*: p ≤ 0.05; **: p ≤ 0.01; ***: p ≤ 0.001). (A) AS-e lines 1,2,3 [3]. (B) AS-h lines 1,2,3 (this paper).
