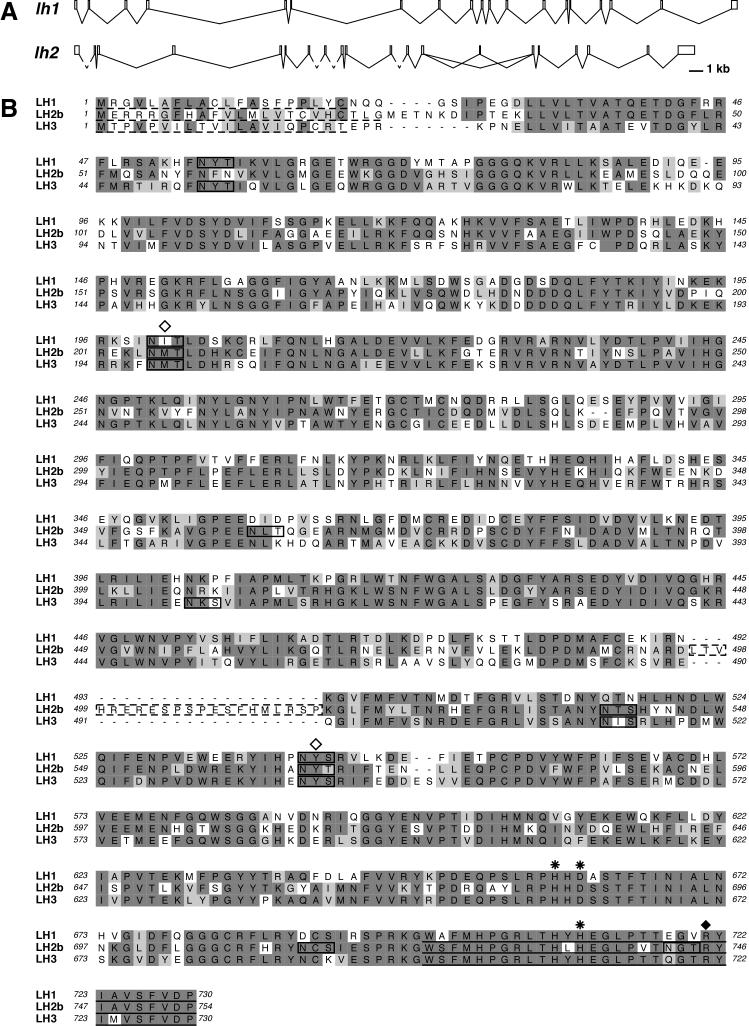
Figure 1.
Comparison of zebrafish lh genes. A: Genomic organization of zebrafish lh1 and lh2. The dashed lines in lh2 represent intron sequences whose lengths could not be determined due to the lack of available genomic sequence. B: ClustalW was used to align the proteins encoded by the zebrafish lh1, lh2 and lh3 genes. In LH2b, the dashed box indicates the residues encoded by the alternatively spliced exon 13A. Identical residues are shown in dark gray, similar residues in light gray. Dashed line: predicted signal sequence. Solid line: putative ER retention signal (Suokas et al., 2003). Boxes indicate potential sites for N-glycosylation. Open diamond: N-glycosylation site required for full enzymatic activity of human LH1 (Pirskanen et al., 1996). Asterisk: Fe2+ binding site (Pirskanen et al., 1996). Closed diamond: 2-oxogluatarate binding site (Passoja et al., 1998a).

