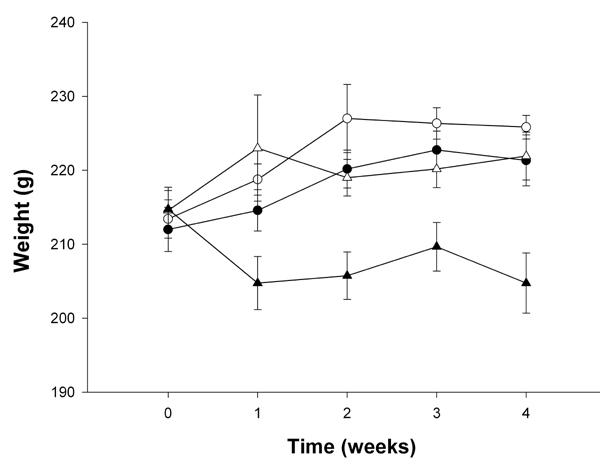
Figure 6. Body weight after treatment with four different diets after 4 wk.

Group A (○) with standard carbohydrate-rich laboratory diet (chow), group B (●) with chow + stevioside, group C (∆) with 80% SPI + 20% chow and group D (▲) with 80% SPI + 20% chow + stevioside. Data are shown as mean ± SEM, n = 12 in each group.
