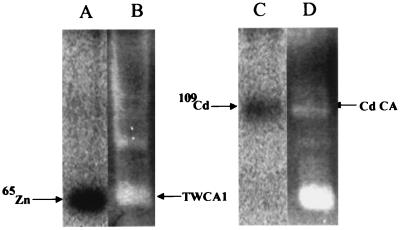
Figure 3.
Native PAGE and CA assay of cell lysates of cells grown at 100 ppm CO2 under different trace metal concentrations. (A) Phosphorimage of a native gel of a lysate of cells grown under 15 pM Zn′ labeled with 65 Zn. (B) CA assay of the same lane shown in A. (C) Phosphorimage of a native gel of a lysate of cells grown under 3 pM Zn′ and 45 pM Cd′ labeled with 109Cd. (D) CA assay of the same lane shown in C.

