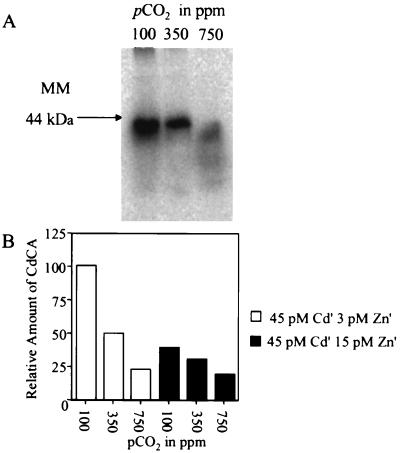
Figure 5.
Modulation of Cd-CA levels by trace metals and pCO2. (A) Phosphorimage of SDS/10% PAGE of total cellular protein of 109Cd-labeled cultures grown at 45 pM Cd′ and 3 pM Zn′ and the indicated pCO2. MM, molecular mass. (B) Graphic representation of results of a typical labeling experiment. 109Cd-labeled cultures were grown at 45 pM Cd′ at either 3 pM or 15 pM Zn′ at the indicated pCO2. Relative amounts of Cd-CA were determined by SDS/PAGE and phosphorimaging.

