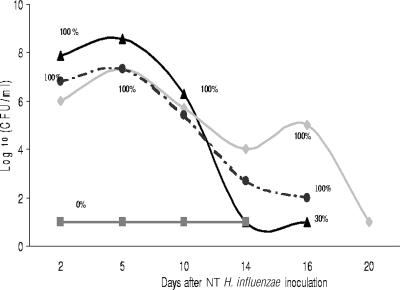
FIG. 2.
Natural history of EOM due to 486 WT and 486siaB in control animals and chinchillas treated with CoVF. The proportion of animals with culture-positive MEF at the time points indicated in each group is represented by the percentage. Symbols: ▴, 486siaB with CoVF (n = 10); ▪, 486siaB without CoVF (n = 5); ⧫, 486 WT without CoVF (n = 2); •, 486 WT with CoVF (n = 2).

