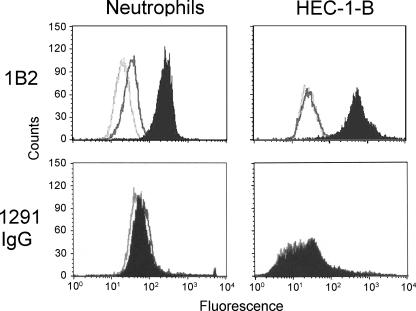
FIG. 8.
Flow cytometry analysis of the binding of MAb 1B2 and 1291 LOS-specific IgG F(ab′)2 to human neutrophils and HEC-1-B cells. For MAb 1B2, the light gray open curve indicates the binding of the secondary antibody alone, the dark gray open curve indicates the binding of the isotype-matched negative control, and the solid curve indicates the binding of MAb 1B2. For 1291 IgG, the light gray open curve indicates the binding of the secondary antibody alone, the dark gray open curve indicates the binding of the negative control IgG F(ab′)2, and the solid curve indicates the binding of 1291 IgG F(ab′)2. The three curves were nearly identical for HEC-1-B with 1291 IgG.

