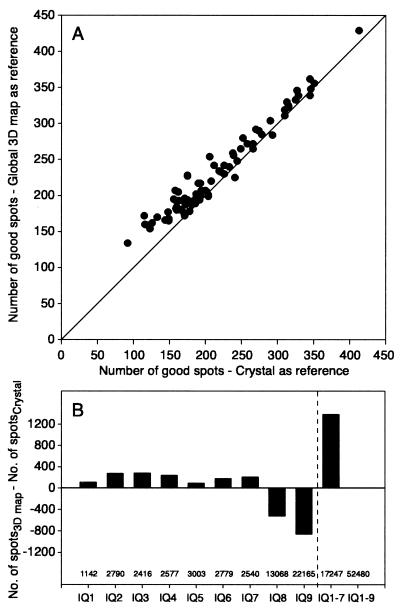
Figure 3.
Number of good spots extracted from the Fourier transform of each image after unbending by using the crystal as reference vs. the 3D density map as reference (A) and difference in the total number of spots extracted for the various IQ classes (B). Amplitudes and phases were extracted with mmboxa after unbending of the image by using either the crystal or the 3D density map as reference. The diagonal line indicates no net difference between the number of extracted good spots (IQ 1–7, 200–5.0 Å) after using the two unbending procedures.

