FIG. 4.
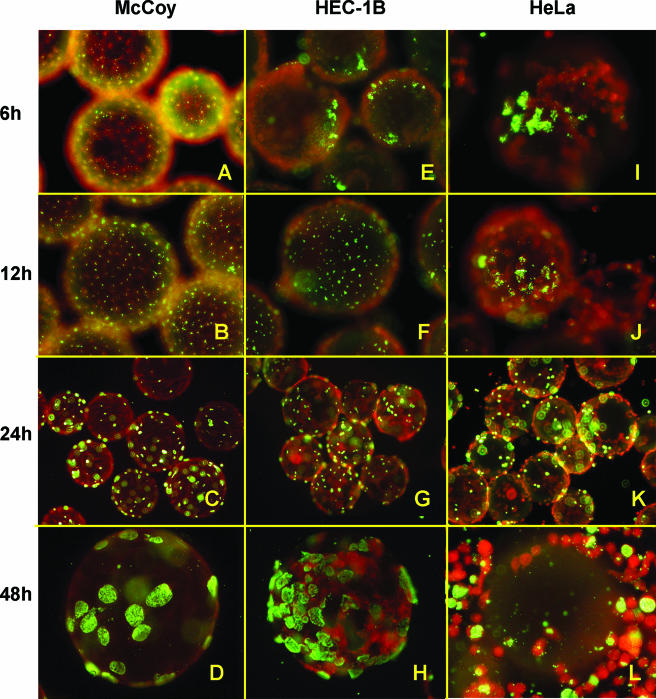
Fluorescence microscopy analysis of C. trachomatis serovar E inclusion formation in McCoy, HEC-1B, and HeLa cells seeded on beads. Infected 3D bead cultures were sampled at various times postinfection; the beads were then washed, fixed, and stained with fluorescein isothiocyanate-labeled anti-C. trachomatis specific antibodies and Evans blue counterstain. Representative fields of bead cultures of the three cell lines, sampled at 6 hpi (A, E, and I), 12 hpi (B, F, and J), 24 hpi (C, G, and K), and 48 hpi (D, H, and L) are shown. Note the even chlamydial EB attachment and distribution (green) throughout the McCoy cell monolayer (red) (A and B) versus the more “patchy” patterns of EB distribution in HEC-1B (E and F) and HeLa (I and J) epithelial cells at 6 and 12 hpi. Inclusions were readily visible in all cell line monolayers at mid-cycle (C, G, and K). At 48 hpi, higher chlamydial inclusion numbers were found in HEC-1B (D) than in McCoy (H) bead cultures, whereas numerous HeLa cells have come off the beads by that time (L). Magnifications: ×300 (A, B, E, F, I, and J), ×150 (C, G, and K), ×450 (D, H, and L).

