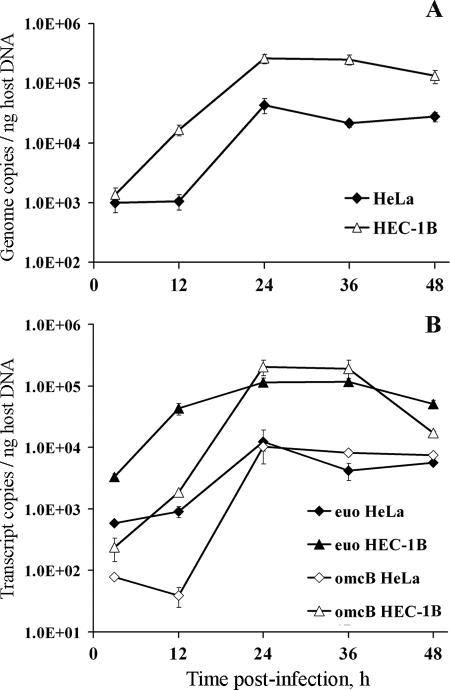
FIG. 7.
Real-time PCR analyses of C. trachomatis serovar E genome numbers and transcript levels in HEC-1B and HeLa cells grown in bead cultures. Aliquots of cultures were sampled at 3, 12, 24, 36, and 48 hpi, lysed, and used for concomitant genomic DNA (gDNA) and total RNA isolation. (A) Chlamydial genome copy numbers in each bead sample were determined by qPCR using euo- and omcB-specific primer sets and chlamydial gDNA standards; copy numbers obtained with the two primer sets were nearly identical and were therefore averaged. Chlamydial genomes were then normalized to the relative amount of host cell gDNA in the same sample, as determined by MPO- and F8-specific qPCR assays (averaged values). Normalized chlamydial genome copy numbers detected in both cell lines are shown on the y axis; sampling times are indicated on the x axis. (B) The levels of specific chlamydial transcripts in bead samples were determined after 2 μg of total RNA of each sample was reverse transcribed, along with an RT-minus (no enzyme) control, and analyzed by qPCR using the same euo- and omcB-specific assays and chlamydial gDNA standards described above. For each qPCR assay and each sample, the adjusted transcript copy numbers (i.e., RT − RT-minus) were then normalized to host cell gDNA as indicated above. Normalized chlamydial transcript levels are shown on the y axis; sampling times are indicated on the x axis. All time course samples were tested in triplicate, and all qPCR assays used had similar high efficiencies (≥97%). The figure shows average data from triplicate wells (± the standard deviation) from a representative time course experiment. Two independent experiments were performed and showed similar patterns.

