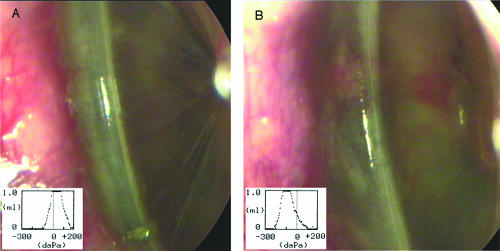
FIG. 2.
Video otoscopy images and tympanometry plots demonstrating changes in the middle ear during infections. Panels are representative images obtained from animals infected with NTHi 86-028NP (A) or NTHi 86-028NP licD (B). Tympanometry readings are shown in the inset of each panel and were obtained at the same time as the otoscopy images.

