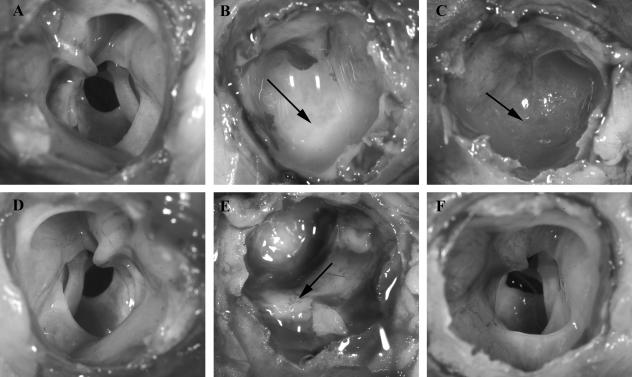
FIG. 4.
Visualization of biofilms within the middle ear of infected chinchillas 7 days (B and C) and 14 days (E and F) after challenge. Uninfected control animals are shown in panels A and D. Animals in panels B and E were challenged with NTHi 86-028NP, while animals in panels C and F were challenged with NTHi 86-028NP licD.

