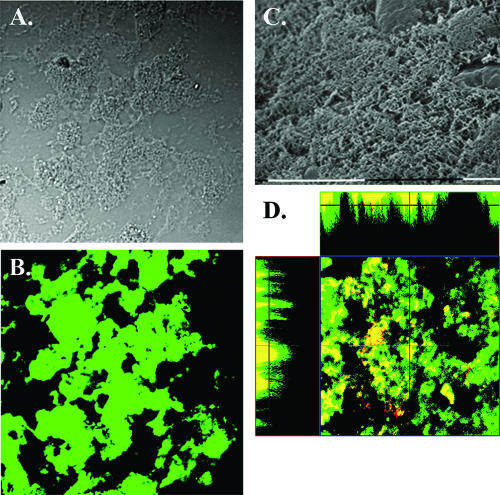
FIG. 5.
Microscopy analysis of NTHi biofilms recovered from chinchilla middle ears. A) Nomarski image of biofilm. B) Same field of view stained with rabbit anti-NTHi serum and fluorescent antibody conjugate. C) Scanning electron micrograph of biofilm removed from chinchilla middle ear. Scale bars, 10 μm. D) Fluorescent confocal laser-scanning microscopy analysis of middle ear mucosa from a chinchilla infected with NTHi 86-028NP. Middle ear tissue was cryosectioned and stained for all NTHi (green) or PCho+ variants (red). Colocalization of both signals appears yellow. A horizontal Z-slice image (center) and vertical stacked Z images (margins) show PCho+ forms within NTHi biofilms.

