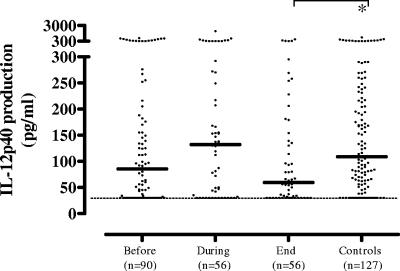
FIG. 2.
M. tuberculosis-induced IL-12/23p40 production tended to be slightly increased after 2 months of TB therapy but decreased at the end of anti-TB therapy in the cross-sectional analysis. This trend was most evident in the longitudinal study (see text; not shown). Each dot in the cross-sectional study represents one individual. A horizontal bar indicates the median of each group. A dashed line indicates the lower detection limit of the assay. A statistically significant difference (P < 0.05) is indicated by the asterisk (Mann-Whitney U test).

